The Case for Better Metrics
Proliferation of data, especially as it relates to performance, has become overwhelming for most organizations. Even still, data availability only constitutes half of the puzzle for managing business performance. Today’s leaders are increasingly expected to harness available data, establish effective KPIs offering visibility into live performance, and drive dynamic optimizations. The ability to implement this effectively is a distinct competitive advantage.
Reporting on KPIs isn’t anything new. But this isn’t the crux of the problem; designing and displaying KPIs that dependably yield reliable insights to the right leaders at opportune moments is much more difficult to navigate. Several factors further complicate this task:
- Disjointed reporting practices stemming from mergers / acquisitions
- Disparate sources of record or measurement methods across systems, sites, or geographies
- Inconsistent KPI calculations used and/or preferred by senior management versus line managers
… amongst plenty of others. Too often, these circumstances result in muddled definitions, a lack of institutional consensus, and altogether unreliable metrics. How, then, are business leaders best to rein in their data and ensure that their KPIs are trustworthy?
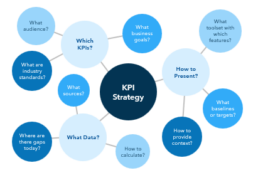
The solution lies in answering the questions in Exhibit 1. One must first understand where others’ efforts have derailed and how best to avoid them. Then, leaders can build a new KPI strategy of their own, including selecting the ideal metrics for the audience, charting out the most well-suited data sources, and leveraging the best visualization methods. This ultimately will require a deep understanding of emerging industry trends that are defining the leading performance measurement strategies of the future.
Exhibit 1. Defining a KPI Strategy
Common Pitfalls
The path to reliable performance measurement has no dearth of traps. It is exceedingly easy to slip into bad habits (see Exhibit 2):
- DATA SELECTION
Many of the issues underlying unreliable KPIs stem from missteps in how performance data is handled:
1.A. Sourcing Data Without Context – Companies frequently end up selecting data to use in KPI calculations solely based on field or column names without truly understanding the data itself. This often happens when gatekeepers or data SMEs are the only ones who know the data, but may not be clearly denoted, or are otherwise not consulted in the process. This leaves consumers without full grasp of the data and how/when it should be used, often leading to arbitrary selection between conflicting sources of truth.
Solution: When sourcing data, any fields of interest should be traced back to their respective roots. Uncommunicated or undiscovered nuances in source data can bubble up and even be magnified in eventual KPIs. As a best practice, this can be forestalled by maintaining robust data dictionaries and lineage.
1.B. Thinking Data-First – Sometimes companies resort to collecting data wherever it is easy to gather, but when it comes time to build KPIs, they discover they don’t have the data they actually need. Without clear foresight, it’s easy to fall into the trap of just leveraging what is most readily available or easiest to record.
Solution: A bottom-up (i.e., data-first) approach can be effective in initially establishing broad data availability, but one must not lose sight of the top-down (i.e., KPI-first) requirements. Building out a data roadmap directly informed by performance measurement goals is one way to ensure that the right data needs consistently stay front and center.
1.C. Drawing Upon Siloed Sources – Companies frequently find their data distributed across unintegrated databases or systems of record, oftentimes with complicated, differentiated access rules and distributed ownership. This makes finding and referencing the right data for KPIs difficult, in many cases requiring that complex webs of data flows be re-built for each definition. Sometimes, companies will thus resort to using data that is the easiest to retrieve rather than the best possible source.
Solution: If possible, KPI data should be sourced from a centralized data lake. While not a rigid requirement, having a common platform for all data boosts visibility into availability of sources and helps to ensure that everyone is pulling their data from an established, reliable location.
- STRATEGIC ALIGNMENT
As alluded to up front, getting performance data in order is only the first step in enabling effective KPIs. The real crux is picking which metrics and how best to calculate them. Common mistakes include:
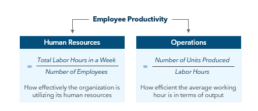
2.A. Relying On Inconsistent Measurement – Companies frequently tend to find themselves in a predicament where different business units, facilities, geographies, etc., each have their own KPI definitions with their own assumptions and nuances. Similar conflicts often arise when metrics have inconsistent or ambiguous units, making figures impossible to compare across categories. A good example of this is the measurement of employee productivity shown in Exhibit 3; while the human resources department may assess productivity as the number of hours worked per employee per week, operations might gauge productivity by looking at units produced per hour worked. Though these two KPIs have the same name, they are measuring something completely different, which can be confusing if performance dashboards on both boil up to the same audience.
Solution: When rethinking existing dashboards, companies should survey industry standard definitions for each KPI and then define uniform calculations for each metric that can be applied consistently across categories. This helps to identify any current gaps or limitations that need to be addressed before figures can be directly compared across sites, geographies, or reporting groups. This may also first entail carrying out a scenario analysis where KPIs are calculated using different possible approaches; in some cases, multiple calculations may even be useful for different business purposes (e.g., as in the employee productivity example) – this isn’t necessarily an issue so long as they are assigned distinct working names and definitions.
2.B. Not Linking Back to Business Strategy – There are many KPIs on which a company could report, and oftentimes those that get priority are determined by factors other than business impact — simplicity of calculation, institutional habits, and easy data accessibility are often cited as rationalizations. KPIs can also lose their utility if calculation methods deviate from industry norms, which can spur issues when benchmarking against established industry standards. This problem tends to arise when KPI definitions are decided on the fly, oftentimes based on something like data availability, rather than by applying a consistent set of pre-defined standards or consulting industry-proven best practices.
Solution: Each of these issues is best addressed by approaching KPIs with a rigid top-down approach. KPIs should be selected by determining where business would benefit most from better insight into performance. Calculation methods are best informed by industry standards where available, and cutting corners should be avoided as much as possible to ensure valid benchmarking.
2.C. Not Tailoring to the Target Audience – As an example, statistics on availability of specific machines in a distribution center is likely not useful for a senior executive not managing day-to-day operations. This typically happens when either the wrong stakeholders are consulted when selecting KPIs (e.g., data engineers instead of managers) or when the set of KPIs isn’t sufficiently narrowed down. In these cases, reports overwhelm the target executives with impertinent information.
Solution: A critical component of deciding which KPIs to prioritize is diagnosing the needs of the target audience and what they require to successfully glean business insights. Keep in mind that KPIs should be at the right level of detail such that the end user of the dashboard sees a call to action appropriate to their role; KPIs that don’t meet this criterion should be excluded to not distract from more impactful figures.
Exhibit 3. Inconsistent KPI Calculation
- VISUALIZATION DESIGN
Discussing how best to present KPIs may seem tangential to rendering them “trustworthy”, but KPIs have little value outside of interpretation by their audience. Providing the tools for the viewer to understand them and trust their reliability is a critical part of their utility. Without delving into visualization best practices more broadly—a separate topic worth a treatment of its own—here are some common pitfalls:
3.A. Failing to Operationalize – Sometimes companies spend significant time and resources on robust KPI tracking just for the results to not be integrated into existing business processes, or to sit off in an inaccessible or difficult-to-find folder that nobody ends up opening. An organization can build the most insightful KPI measurements possible, but if they aren’t in the right places for the right people to see, their potential to make a tangible impact is vastly diminished.
Solution: KPIs should be front-and-center for employees and leaders to ensure that core business goals are always kept top of mind. To return to the example of a distribution center, having a screen on the wall with key metrics for all workers to see keeps everybody on the same page about what needs to be accomplished and how they may be falling behind. Of course, this may require training employees on what important metrics mean and how they should be interpreted—a requirement that can be eased through robust contextualization, as will be discussed—but the broad ability to interpret data is nonetheless critical to fostering a KPI-first mentality.
Exhibit 4. KPI Contextualization

3.B. Unhelpful Displays – Companies often don’t present KPIs in a manner that is easy to use for consumers and enables them to quickly retrieve the information they are looking for. Problems include:
i. Lack of easily accessible documentation – KPIs may not feel trustworthy if the assumptions underlying them are not clearly documented and if an accountable point-of-contact is not defined
ii. Inability to dive deeper into data – it can quickly become frustrating if users are only able to view a KPI value in one pre-defined manner and cannot manipulate or export the calculated values
iii. Use of an ill-suited toolset – users may not feel empowered to access KPIs if they aren’t comfortable with the toolset; conversely, clinging solely to familiar tools that aren’t suited to the workload of the reporting being built can render them slow and unusable
Solution: Wherever a KPI is presented, there should also be easily accessible documentation that explicitly outlines how the KPI is calculated, where the data came from, what assumptions were made, and who is accountable for explaining the results. Additionally, consumers should be able to manipulate the KPI parameters (e.g., filters, date ranges) and export values to external tools. These are both important considerations when selecting the right toolset, which should also be tailored to the use case and to users’ technical abilities
3.C. Overlooking Context – Some KPIs are very difficult to interpret without understanding the range in which they should fall, or otherwise how their values compare to historical and/or industry trends. To reuse a previous example, simply presenting a number of machine downtime hours may not be useful if the consumer of the KPI doesn’t know what downtime looks like on a good day. Without the tools to interpret a figure, consumers may be left without the knowledge needed to draw actionable insights, defeating the metric’s purpose in the first place.
Solution: Most people would conceptualize a KPI as a numerical value, but it’s important to remember that a KPI is an indicator; numbers without a context are often poor indicators of anything. There are certain critical components of how raw figures are presented without which they could hardly be considered KPIs. Some examples include RAG statuses, ranges of acceptable values, historical averages, and target values. Including contextual values (as in Exhibit 4) will ensure the end user knows exactly what KPI figures should mean.
Building Trustworthy KPIs
Now that it is clear what should be avoided, how do business leaders actually go about constructing and operationalizing the best KPIs for their organization? There are three main steps to this process: firstly, deciding which KPIs to use, secondly, locating the best data sources to support those calculations, and lastly, picking the best way to present the results.
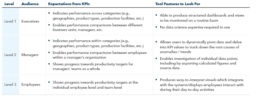
- Which KPIs? Each industry and every business has its own set of relevant KPIs upon which it makes sense to focus. However, when selecting these KPIs, it is always imperative that the primary consideration is the business needs of the audience for which they are intended. The metrics useful for measuring performance can vary vastly across groups; some guidelines for picking the best KPIs suited to different audiences’ needs are outlined in Table 1.
Table 1. Audiences & Expectations
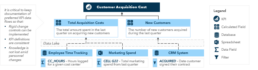
- Which Data? It’s easy enough to select a list of KPIs on which to focus, but how will each of them realistically be calculated? Leaders should first apply any abstract, mathematical KPI definitions to their specific data contexts. Building a map of data flows (see Exhibit 5) helps to create consistent definitions and to identify any critical gaps that need to be integrated into future engineering plans. Maintaining this sort of visual documentation is also helpful in facilitating change controls down the line and establishing a single source of truth for how KPIs ought to be calculated. Lastly, this will help to forestall the presence of gatekeepers who are the only ones knowledgeable on how KPIs are or should be calculated, enabling smooth transfer of knowledge and continuity over time.
- How to Present? With the metrics and their data flows sorted, the next question is how best to make the KPIs useful and readily available to their audience. For each KPI, a distinct vision for how it will be contextualized should be crafted: each needs a benchmark or “ideal” range that should be presented along with it (oftentimes implicitly in a visual). This should be identified, along with a plan for maintaining any dynamic or moving targets, in advance of beginning to build downstream displays. In addition, care must be put into picking the proper visualization tools; the toolset should be closely tailored to the needs of the target users such that they find KPIs easy to access and integrate into their workflows. Some tips on the requirements of different audiences can be found in Table 1.
Exhibit 5. Example KPI Calculation – Data Flow Documentation
What the (Near) Future Holds
Many institutions already face their own idiosyncratic circumstances that call for a renewed look at their KPI strategy. However, there are some noteworthy industry-wide trends as well:
AI IN BI
The advent of AI in business intelligence tools is enabling business leaders to extract more value from their KPIs than ever before. These new features provide exponential gains when it comes to quickly identifying anomalies, crafting response plans, and pivoting visuals to rapidly drill down to root causes. This only further accentuates the case for building better KPIs; leaders who want to drive the maximum amount of value from these new features will need to ensure that their performance measurement strategy is optimized and airtight. To give a preview, here are a few key capabilities which are at the forefront of the AI revolution in BI:
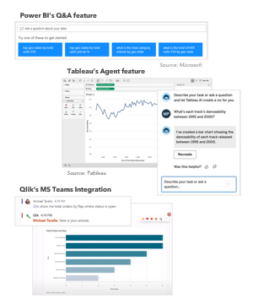
Natural Language Prompts & Visual Creation – Once upon a time, KPI consumers were limited to a set of pre-created visuals that took entire teams and hours of work to produce. Now, powerful new tools like Power BI’s Q&A feature, Tableau’s Agent, and Qlik’s Staige product (see Exhibit 6) can generate customized visuals in response to simple natural language prompts. Further, users can ask the AI questions about their data, enabling them to delve deeper into KPI values without having to enlist a data science team to scour the source tables to investigate root causes.
Exhibit 6. Natural language prompts in BI apps
AI-Driven Interpretation & Alerting – One of the primary goals of KPIs is to help leaders identify the right business insights at the most opportune moments, and new AI-based tools are helping users do just that (see Exhibit 7). Products such as Tableau Pulse produce natural language KPI updates for users which are tailored to their role, automatically flagging anomalies and trends to watch out for. Similarly, Power BI’s Insights feature enables users to leverage AI to analyze their KPI trends and receive notifications whenever something looks awry.
DEMOCRATIZATION OF ANALYTICS
As BI tools become more user-friendly, they also become available to a wider audience with less data science expertise. As a result, leaders are taking initiative to equip their employees up and down the corporate ladder with the tools to use data to make strategic decisions. Expensive analytics teams are being replaced by business resources armed with low-to-no-code tools and AI-based insights that anyone can generate.
Though this enables much finer performance measurement, it can also unleash chaos if companies do not have rigid, well-publicized KPI calculation methods and preferred data sources; it is hard to stay organized when everyone is reporting on different metrics. Such decentralization places a renewed emphasis on avoiding the many aforementioned KPI pitfalls and building a well-defined KPI strategy.
In Conclusion…
Performance management has become unwieldy in the era of AI and big data. As performance data proliferates, and access to insights becomes more open, leaders must revisit their approach to performance measurement.
Navigating these challenges requires a constant awareness of the barriers and roadblocks that all too often leave companies stranded with confused KPI definitions and a lack of business insight. The solution entails understanding the audience, tracing source data back to its roots, and presenting KPIs in context with the tools needed to yield dependable intuitions.
Altogether, achieving truly trustworthy KPIs requires deep focus and resolve to not lose sight of key best practices. But the benefits are substantial: from better performance management to quicker responses to changing conditions, heightened insight into optimization opportunities enables the steadfast confidence needed to make important business decisions. A well-constructed KPI strategy has the potential to set leaders apart from their peers and players ahead of their competition.
Exhibit 7. AI-driven interpretation in BI apps